|
137 South Road Thebarton South Australia Australia 5031 |
|
| T | +61 8 8234 0511 |
| info@archimedes-consulting.com.au | |


Energy Spectral Analysis (ESA)
Horizon Interpretation
Archimedes has developed a unique method of analysis of potential field data, Energy Spectral Analysis - Moving Window (ESA-MW). This is the principal method used in mapping basement and geological horizons and trends from gridded magnetic, gravity and gradiometry data sets.
Spectra Interpretation
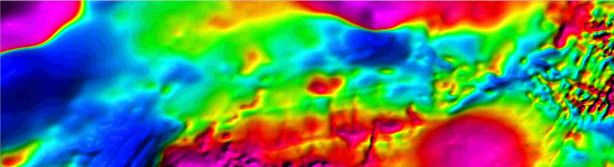
The Energy Spectral Analysis method applied to magnetic, gravity and gradiometry grid data allows calculation of an average depth to ensembles of causative bodies. From the slope of the linear segment of the spectrum graph, the depth is calculated. Depth is computed from the decay of the spectrum function within a corresponding frequency interval. A plot of the logarithm of the radially averaged energy spectrum vs the radial frequency from gridded magnetic, gravity or gradiometry data shows the decay of this function which indicates depth to the magnetic susceptibility or density interface. These depths are unique and are not dependent on assumed or measured susceptibilities or densities.
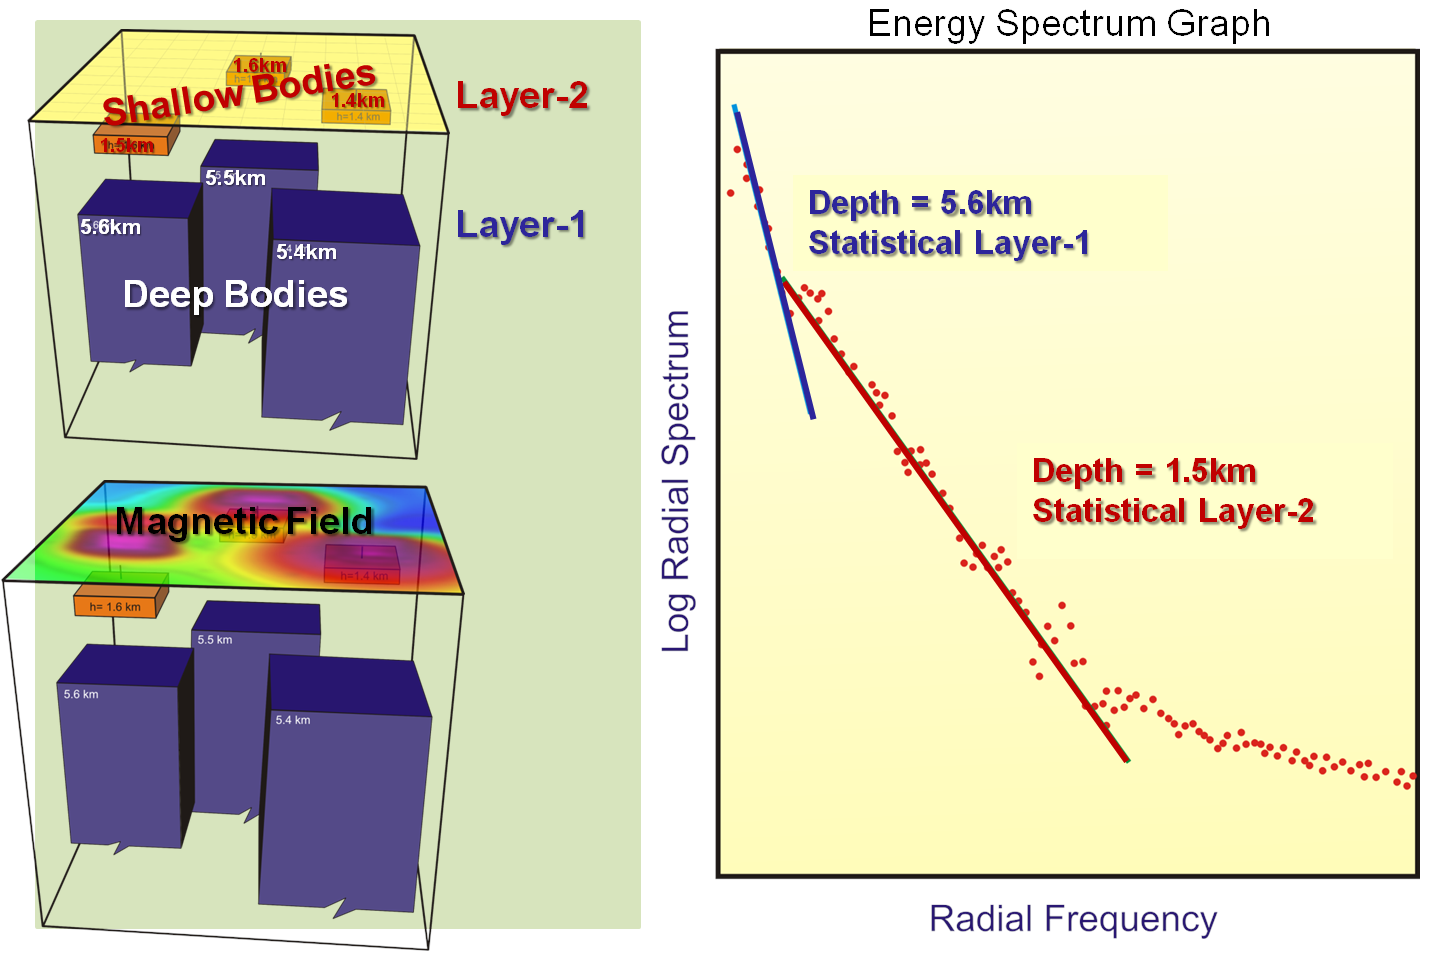
Multiple linear segments (slopes) on the spectrum correspond to separate depth ensembles, implying multiple inhomogeneities. The synthetic model shown in Model & Spectrum has two layers made up from three prisms each. A magnetic field was computed from the bodies and a spectrum generated. The energy spectrum graph shown on the right depicts the 1st slope, the steepest, which corresponds to the deeper bodies dominating the low frequency zone. The depth value is the average depth to these three deeper bodies. The 2nd slope indicates the average depth to the three shallower sources.
ESA-Multi-Window Technique (ESA-MWT)
The areal size of the data set analysed (window) limits the depth being investigated. To determine an optimal window size the 'Multi-Window Technique' is applied by varying the window size over the same location. For each window the spectrum is computed and using Archimedes proprietary software either in human-guided or semi-automatic fashion, the spectra are interpreted and the depth is computed. Then the spectrum derived depth is plotted vs window size. As the optimal window size is approached, the increasing window size detects depths which oscillate around the same value; this is referred to as a 'depth-plateau', on a depth vs window size graph (see ESA-MWT Video).
These depth-plateaus correspond to the magnetic or gravity interfaces (surfaces/sources), where contrasts exist such as magnetic susceptibilities for magnetic data or density for gravity data. The identification of such depth plateaus indicates the presence of crustal inhomogeneity which may correspond to the basement surface, an unconformity or the top of an intra-sedimentary lithological boundary. The window size is varied to focus on different depths of investigation, small windows investigate shallow depths as the shallow sources produce high frequency anomalies and larger windows investigate greater depths as the deep-seated bodies generate long wavelength anomalies contributing to the low frequency zone.
An analysis at a particular location which indicates two plateaus implies two stacked sets of anomalies, indicating two geological interfaces such as the base of salt and basement horizon or a base of basalt and basement horizon.
ESA - Moving Window
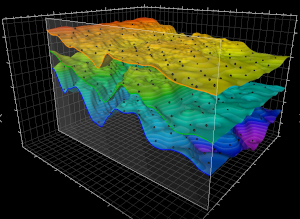
The window of analysis can now be moved around the dataset to build up a skeleton depth map of the interpreted horizon. The 'Moving Window' process begins with an initial low resolution interpretation (with sparse points of analysis) utilising the results from MWT. This procedure can be run fully automatically; however it is always also undertaken manually to establish a credible geological model. The results can then be gridded and mapped for quality control, including comparisons against other geological or geophysical information, such as well or seismic data (see Wells vs MWT Video).
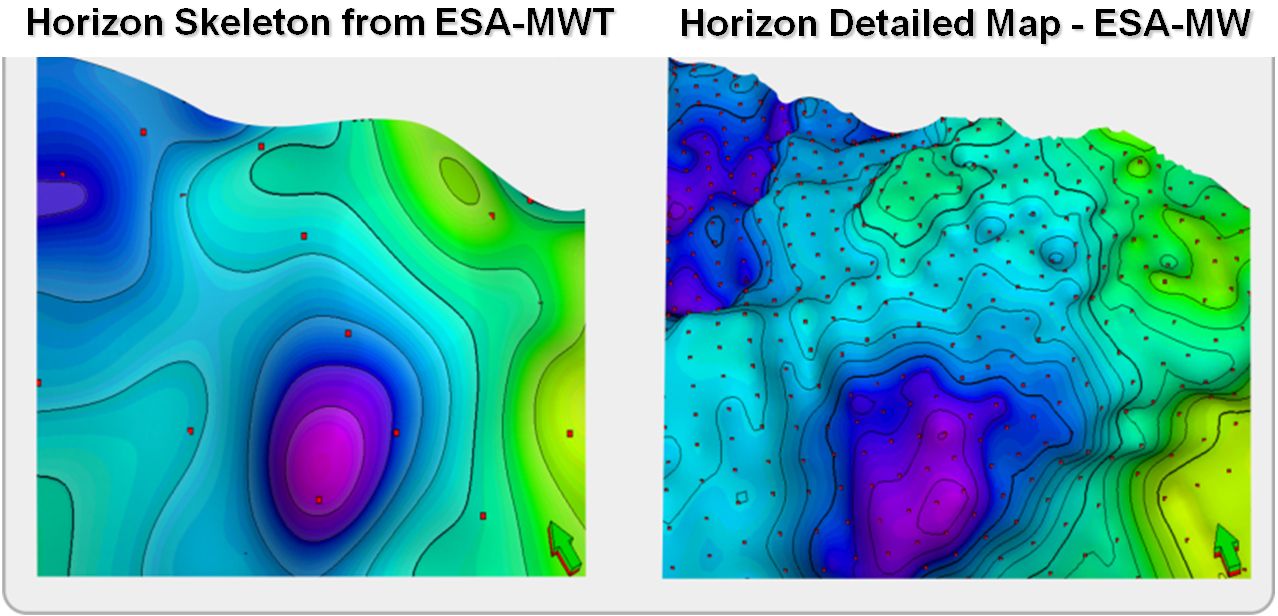
The skeleton depth map is then in-filled through various iterations of spectral interpretation, in order to produce a high resolution map of the surface. During this interpretation process the map view window is continually monitored. High resolution interpretation is however dependent on the line spacing of the acquired data. The objective, independent depth solution obtained from the spectra decay and this high density analysis (detailed mapping) is what differentiates the Archimedes approach and produces the final high resolution map of the geological horizon (Comparison of Skeleton & Detailed Mapping).
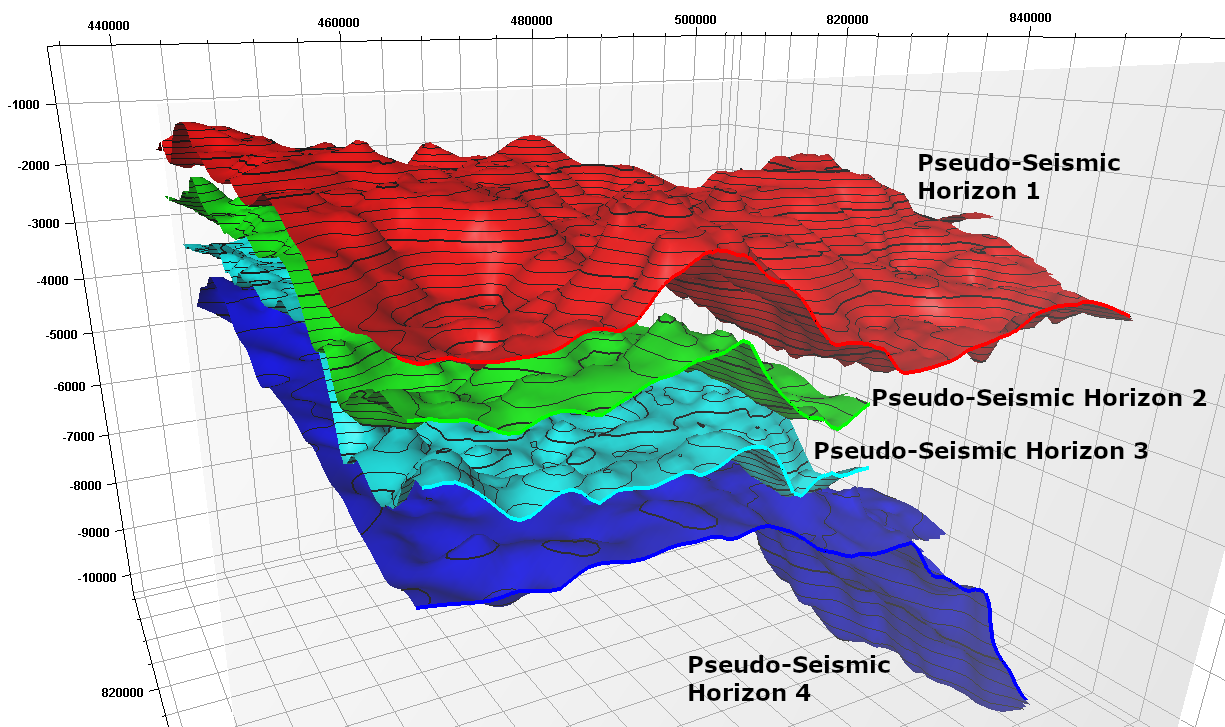
The same process is repeated for the deeper horizon or lower frequency anomalies, indicated by presence of the second plateau. The final product, a structural depth map of the two horizons, is produced. When multiple plateaus are seen the multiple horizons are imaged (see Four Interpreted Pseudo-Seismic Horizons from Malaysia & Interpreted Basement & Nubian Sandstone, Sirt Basin, Libya Video.
Summary
This intensive approach (detailed depth grid) distinguishes Archimedes from other companies using conventional modelling techniques. Archimedes seeks to extract the full high resolution information gathered in the data acquisition in their processing and interpretation phase. Greater effort produces higher resolution results.
The output from Energy Spectral Analysis (ESA) and its various refinements are delivered in a geoscience work station compatible format. This enables our clients to further integrate the results into their sub-surface mapping projects (see Integration of Pseudo-Seismic Horizon & Faults with Seismic Sections Video).
ESA-MWT Video
Wells vs MWT Video
Interpreted Basement & Nubian Sandstone, Sirt Basin, Libya Video
Integration of Pseudo-Seismic Horizon & Faults with Seismic Sections Video